Digital diagnostics uses electronic tools and software to read vehicle data, identify fault codes, and monitor system behavior. In an auto shop, a technician may connect a scan tool to the vehicle’s diagnostic port. They can then compare stored codes with live sensor readings. That evidence helps narrow the search. It does not identify every failed part. A warning light is a clue, not a verdict.
How do automotive workshops benefit from digital diagnostics? The practical gains include faster initial checks, clearer repair records, and better communication with customers. For example, a technician can review engine temperature, oxygen-sensor data, or battery voltage before recommending a repair. When a fault appears intermittently, saved data may reveal the conditions that triggered it. That can reduce guesswork. Still, readings need context. A damaged wire, weak connection, or outdated software can produce misleading results. Skilled technicians verify findings through inspection, testing, and vehicle-specific service information.
Digital diagnostics can also support a consistent workflow across busy service bays. Shops can record codes before and after repairs, helping explain what changed and what remains unresolved. Customers benefit from specific explanations: which system raised a concern, what testing confirmed it, and why a repair is recommended. The tools are not magic. A scan report can look precise while leaving important questions unanswered. Good diagnostics combines digital evidence with hands-on experience and careful judgment. A little humility matters, too.
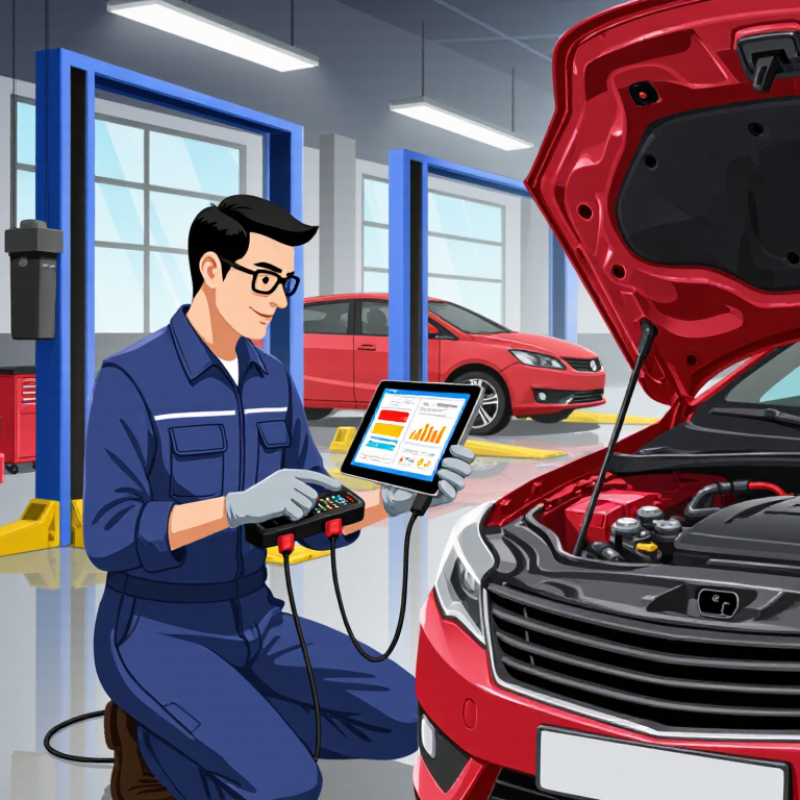
Digital diagnostics combines scan tools, vehicle sensor data, and repair information to help technicians locate faults. A warning light is only a clue, not a complete diagnosis. A stored code may point to an electrical circuit, while live readings show voltage changing as the engine runs. Technicians compare those readings with service specifications, then inspect wiring, connectors, and mechanical parts. The screen narrows the search; it does not replace skilled hands.
The need is growing. S&P Global Mobility reported that the average age of U.S. light vehicles reached 12.6 years in 2024. Older vehicles can bring worn components alongside increasingly complex electronics.
Digital records can also help shops document test results and explain repairs clearly. But a code reader alone can mislead. A sensor fault may come from damaged wiring, not the sensor itself. That distinction takes judgment, and diagnosis is not always tidy.
Digital diagnostic systems gather vehicle data through the OBD-II connector or, on some newer vehicles, through approved network interfaces. A technician plugs in a scan tool, which requests information from onboard control modules. SAE International’s J1979 standard describes common diagnostic services, including requests for trouble codes and live parameter values. The system may show engine speed, coolant temperature, fuel-trim readings, and stored fault codes. Freeze-frame data can capture conditions at the moment a fault was recorded. That snapshot helps put a warning light in context.
Some systems also read data from transmission, braking, or body-control modules, though access varies by vehicle and tool. S&P Global Mobility reported that the average age of U.S. light vehicles reached 12.6 years in 2024. For shops, that means diagnostic equipment may need to interpret data across many vehicle generations.
The readings are clues, not verdicts.
A code naming a sensor does not prove the sensor has failed; damaged wiring or a poor connection can produce similar symptoms. Technicians compare scan results with the driver’s description and hands-on tests. Sometimes the data still leaves a gap. That uncertainty is worth recording, not hiding.
Digital diagnostic information gives technicians more than a fault code. It can show sensor readings, system voltage, and the conditions present when a problem occurred. A technician may review freeze-frame data, then compare it with live readings while the engine idles or the vehicle is driven. A temperature reading that rises too slowly, for example, may point toward a cooling-system issue, but it does not identify the failed part by itself.
Context matters. The technician compares scan results with the driver’s description, service history, and a hands-on inspection. If a code indicates an airflow problem, they may check a connector, inspect the intake path, and look for readings that change unexpectedly. One clue is rarely enough. A rushed reading can still mislead, especially when a fault appears only under specific conditions. Technicians should confirm a suspected cause with appropriate tests before recommending a repair, then check the readings again afterward. Some results remain uncertain; good diagnosis means recognizing that and explaining what still needs verification.
| Diagnostic information | Example reading | What the data may indicate | How a technician interprets it | Typical next step |
|---|---|---|---|---|
| Diagnostic trouble code (DTC) | P0302 — Cylinder 2 misfire detected | The engine control module detected uneven combustion associated with cylinder 2. | A code identifies a system or condition to investigate; it does not by itself prove which component has failed. | Review freeze-frame data, inspect ignition and fuel components, and perform targeted tests before replacing parts. |
| Misfire counter | 24 misfires on cylinder 2 during a road test | Repeated misfires can contribute to rough running and may increase emissions. | Compare counts across cylinders and operating conditions. A rising count helps confirm whether the concern is active and repeatable. | Check the spark plug, ignition coil, injector operation, compression, and wiring as appropriate. |
| Short-term fuel trim (STFT) | About +18% at idle; about +4% at 2,500 rpm | The engine computer is adding fuel to correct a lean-running condition. A stronger correction at idle can be consistent with an intake air leak. | Interpret the reading with long-term fuel trim, engine temperature, load, and bank-to-bank comparisons; values vary by vehicle and conditions. | Inspect intake hoses and vacuum connections, then use suitable tests to locate the cause rather than assuming a specific part has failed. |
| Engine coolant temperature | 88°C (190°F) after warm-up | This is a plausible operating-temperature reading for many warmed-up engines. | Compare the scan-tool value with ambient conditions, gauge behavior, and the vehicle’s specified operating range. A cold reading after a long drive may warrant investigation. | Check coolant level and temperature-sensor data; assess the thermostat and cooling system if other evidence supports a problem. |
| Upstream oxygen-sensor signal | Narrowband signal fluctuates roughly between 0.1 and 0.9 V in closed-loop operation | Switching can be consistent with normal fuel-control activity on systems using a conventional narrowband sensor. | Confirm the sensor type and operating mode first. A single voltage snapshot is not enough to judge sensor or fuel-system performance. | Review a live-data graph alongside fuel trims and downstream sensor behavior; follow vehicle-specific test procedures. |
| Freeze-frame data | Fault recorded at 2,100 rpm, 72 km/h, and 84°C coolant temperature | This captures selected operating conditions present when a fault was stored. | Use it to reproduce or understand the circumstances, such as engine load and temperature. Freeze-frame values are historical, not necessarily current. | Compare the recorded conditions with a controlled road test and current live data. |
| Charging-system voltage | 12.4 V with engine off; 14.2 V with engine running | These readings can be consistent with a charged 12-volt battery and an operating charging system, depending on temperature and vehicle strategy. | Voltage alone does not establish battery health or alternator performance; smart charging systems may vary output. | Test battery condition and charging performance under the manufacturer’s specified load and operating conditions. |
| Readiness-monitor status | One emissions monitor reports “Incomplete” after a battery disconnect | The vehicle may not have completed the driving conditions needed to run that monitor. | An incomplete monitor is not, by itself, proof of a failed component or an active fault code. | Check for stored or pending codes and complete the applicable drive cycle when safe and appropriate. |
Note: These readings are illustrative examples. Diagnostic values and test procedures vary by vehicle, engine, sensor type, and operating conditions. Technicians should verify findings against vehicle-specific service information and confirm suspected faults with appropriate tests.
Digital diagnostics helps auto shops find problems with less guesswork. A technician connects a scan tool to the vehicle and reviews fault codes, live sensor readings, and system data. The information can point toward areas that need testing, such as a misfiring cylinder or an unusual temperature reading. It is a starting point, not a verdict.
That distinction can save time. Instead of replacing parts based on a hunch, technicians can compare readings with service information and confirm the fault with targeted checks. A clear digital inspection report also lets service advisors explain findings with photos, measurements, and plain language. Customers can see why a repair is recommended, which often reduces repeated explanations and approval delays.
Workflow improves, too. Diagnostic notes stored with a repair order help the next technician understand what has already been checked. Shops can spot recurring issues and plan parts or bay time more accurately. Still, digital tools do not make every diagnosis fast. Some faults appear only when a vehicle is cold, under load, or driven over rough pavement. Data can also mislead when a sensor or connection is faulty. The screen is useful, but careful testing and technician judgment still matter. A missed detail can send the whole process sideways.
Illustrative time estimates for common diagnostic tasks (minutes per repair order). Digital tools can bring vehicle data, diagnostic information, and reporting into a more connected workflow; actual time savings vary by vehicle and repair.
Digital diagnostics helps technicians read fault codes, monitor sensor data, and spot patterns that may not appear during a quick visual check. A scan tool can show engine temperature, fuel trims, or misfire counts while a vehicle runs. Useful, but incomplete. A trouble code points to a detected condition; it does not automatically identify the failed part. A loose connector, weak battery, or damaged wire can produce clues that resemble a component failure.
Tips: Record the codes and freeze-frame data before clearing anything. Note when the symptom occurs, such as during a cold start or uphill acceleration. Check battery voltage and inspect related wiring and connectors. Compare live readings with reliable service information, and confirm repairs under similar conditions.
Digital results also depend on tool capability, software updates, and technician interpretation. Intermittent faults may disappear before a scan, while a displayed reading can be misleading if its sensor or circuit is faulty. It is easy to trust a neat graph too much. Use scan data alongside the customer’s description, physical inspections, and appropriate tests. After a repair, verify the original symptom is gone and check whether relevant codes return; a cleared warning alone is not proof.
It can show fault codes, sensor readings, system voltage, and conditions recorded when a problem occurred. Freeze-frame data may capture details from the moment a fault appeared.
No. A code points to a detected condition, not necessarily its cause. A loose connector or damaged wire may create similar clues.
They compare scan data with the driver’s description, service history, and physical checks. They may inspect wiring, connectors, or the intake path, then run targeted tests.
Freeze-frame data records conditions at a particular moment. Live readings show what is happening now, such as engine temperature while the vehicle idles.
Reports can include photos, measurements, and plain-language explanations. Customers can see why a repair is suggested, though the data still needs careful interpretation.
Save the codes and freeze-frame data. Note when the symptom happens, such as during a cold start or uphill acceleration.
The problem may disappear before the vehicle is scanned. It might only occur when the engine is cold, under load, or on rough pavement.
Recreate similar conditions and check whether the original symptom is gone. See whether relevant codes return. A cleared warning alone proves little.
Digital diagnostics uses electronic tools to collect and organize information from a vehicle’s onboard systems. Sensors and control modules record data about components and operating conditions, which diagnostic equipment can retrieve and display for a technician. By reviewing fault codes alongside live readings, service history, and a physical inspection, technicians can better understand what may be causing a problem and decide which checks to perform next. The data provides clues rather than a guaranteed diagnosis, so skilled interpretation remains essential.
For auto shops, digital diagnostics can help prioritize inspections, reduce unnecessary testing, explain findings more clearly, and plan repairs with greater efficiency. When considering how do automotive workshops benefit from digital diagnostics, the key is using timely vehicle information to support consistent decisions and smoother communication with customers. Results should be verified with appropriate tests, equipment should be maintained, and technicians should avoid replacing parts based only on a code. These practices help shops use diagnostic technology responsibly while recognizing that not every issue can be identified digitally.

Manata Scanner